Project Overview
This marketing analytics project was designed to simulate a real-world business case where a company wants to analyze its customer journeys, marketing campaign performance, and product review sentiment using data science tools.
The project combines SQL for data cleaning, Python for natural language processing (NLP), and Power BI for interactive visualization, providing a comprehensive overview of customer behavior and campaign effectiveness.
Key Features
| Component | Details |
|---|---|
| SQL Data Preparation | Cleaned multiple tables, normalized fields, and handled duplicates |
| Customer Journey Mapping | Tracked customer visits, actions, and funnel stages |
| Engagement Metrics | Extracted views, clicks, likes, and converted date formats |
| Sentiment Analysis (NLP) | Applied VADER in Python to classify reviews into sentiment categories |
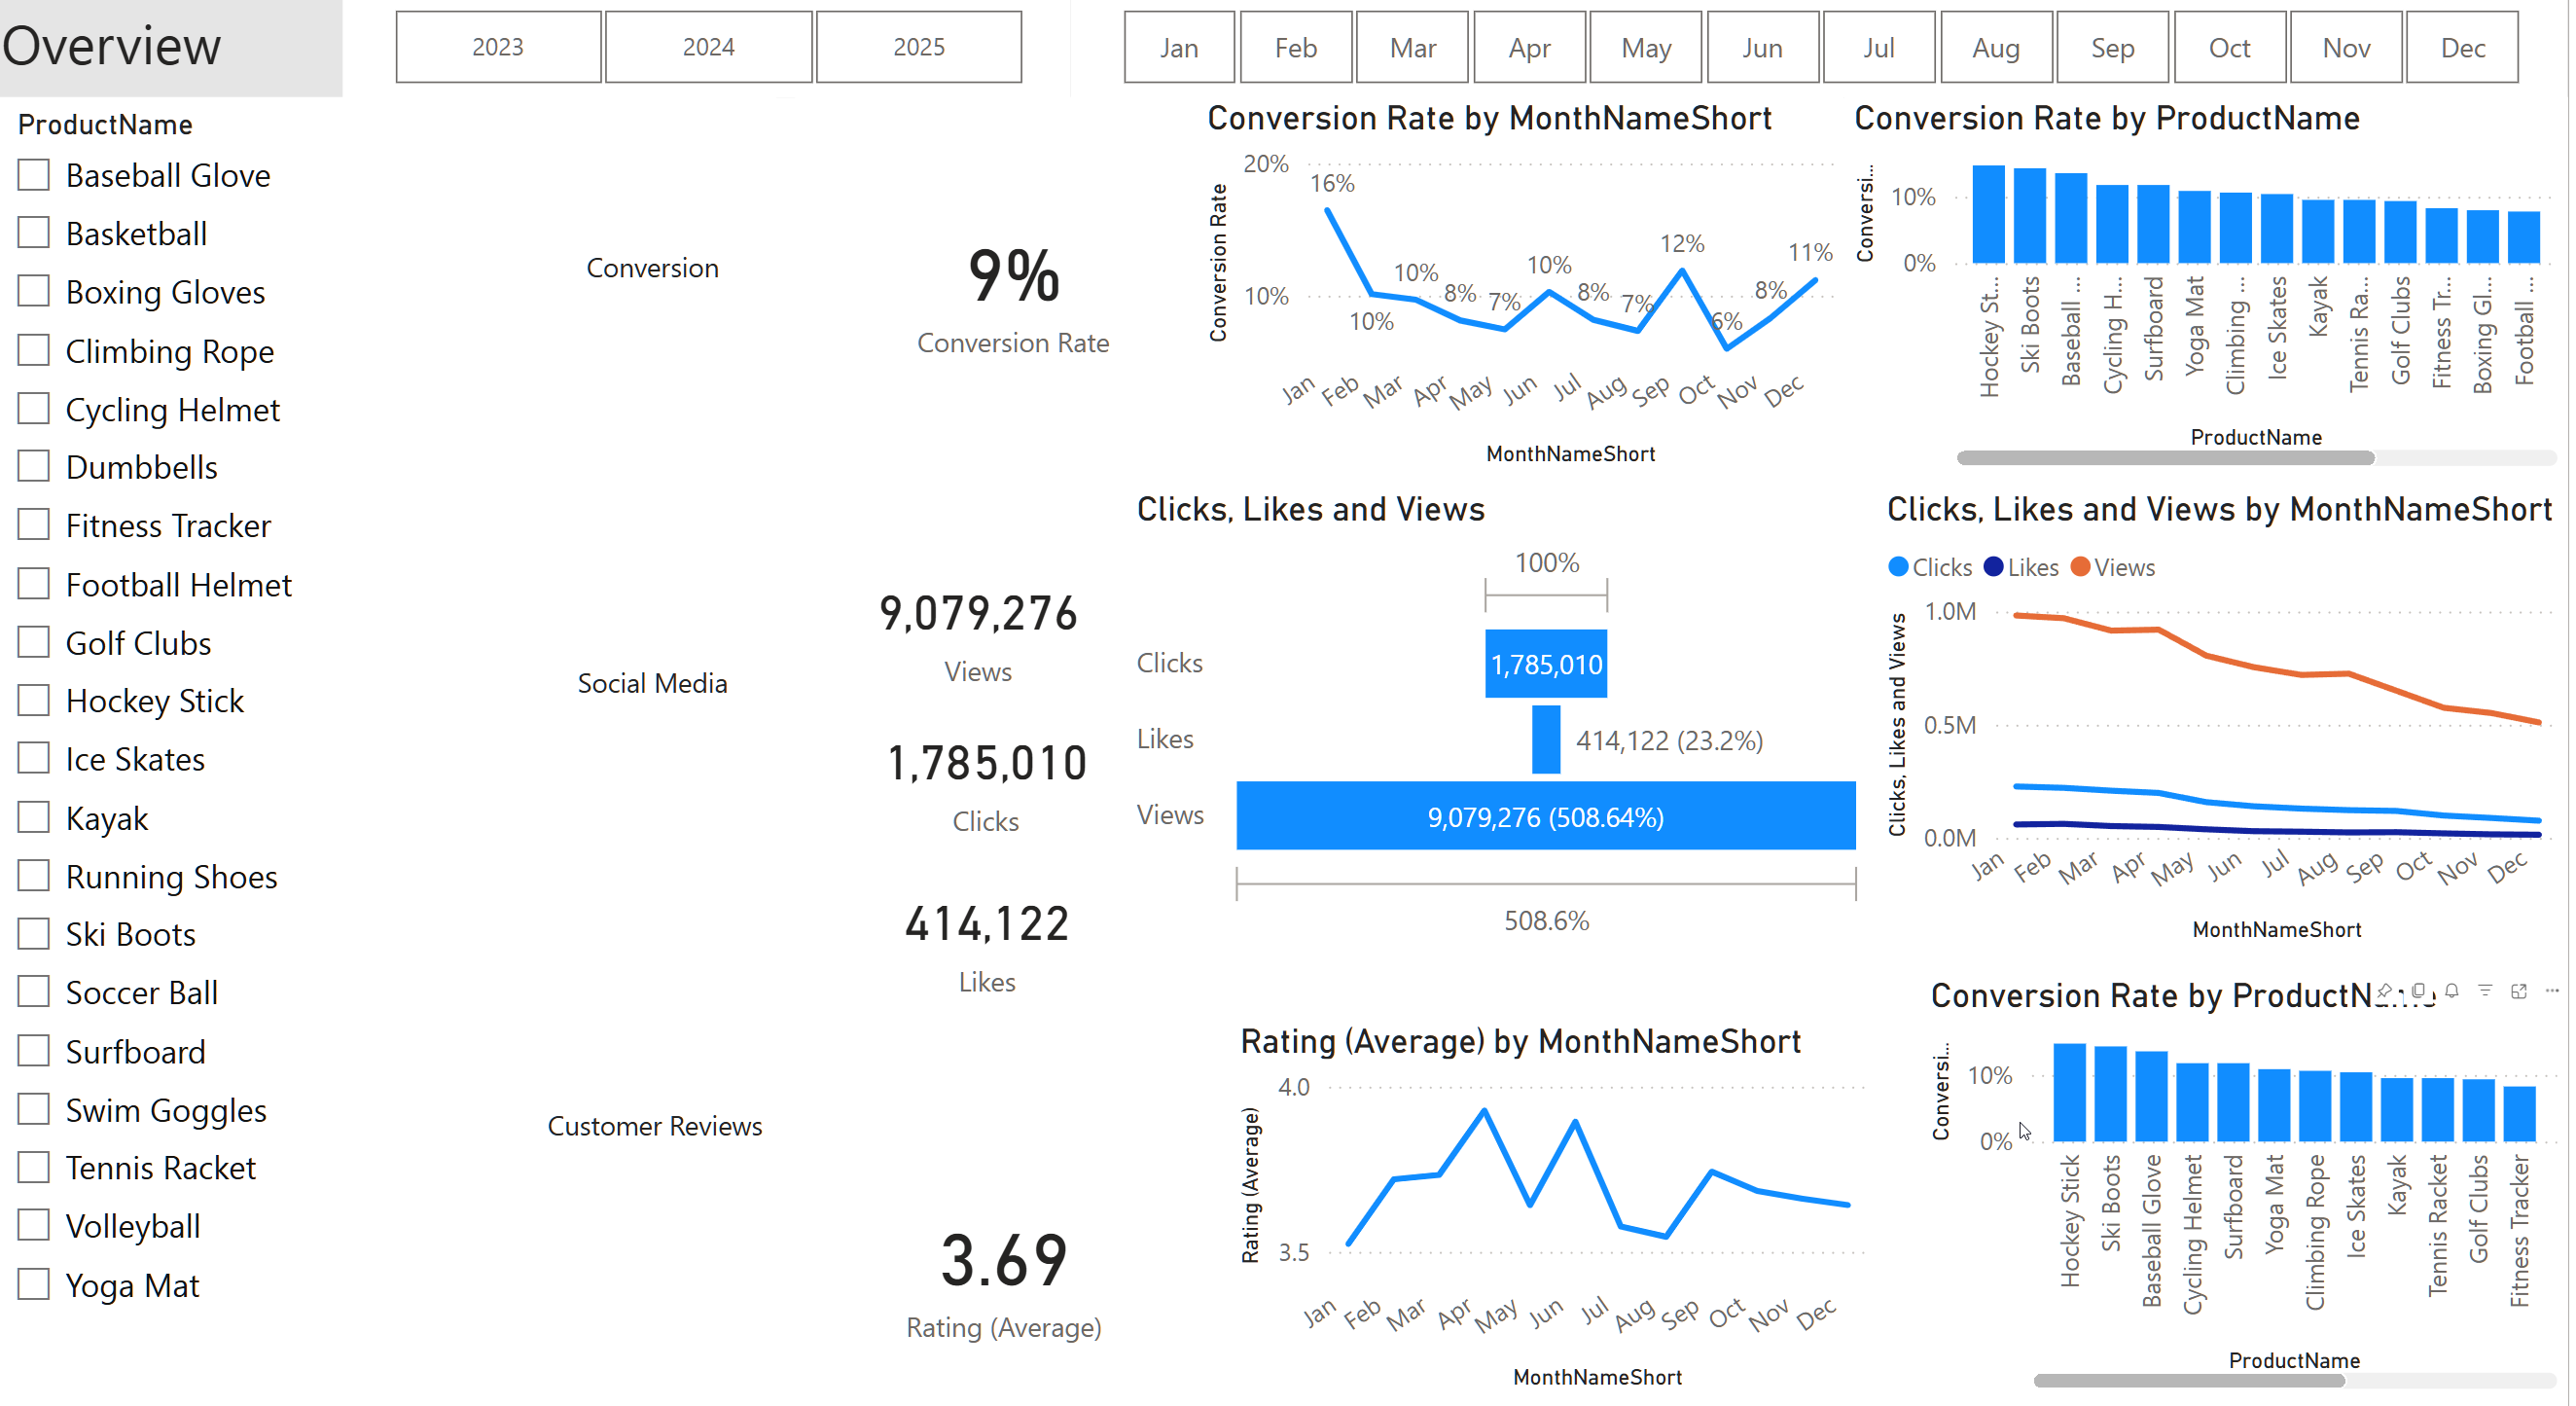
| Power BI Dashboard | Created interactive visuals for customers, products, and campaigns |
| Review Bucketing | Grouped reviews into sentiment score buckets using compound polarity |
Technical Stack
- SQL Server (via Docker) to restore and query
.bakdata files - Python (NLTK + pandas) for review enrichment and text analysis
- Power BI for dashboard reporting
- Azure Data Studio for managing database operations
Live Dashboard Access
The Power BI report is hosted and publicly accessible for demonstration purposes:
Purpose of the Project
The project was structured to mimic what a data analyst or business intelligence professional might do in a retail or marketing role. The aim was to connect and transform raw data into insights that stakeholders could act on—particularly around campaign engagement and product feedback.
Learning Outcomes
This project helped build expertise in:
- Managing relational databases in Docker containers
- Enriching datasets with Python for sentiment tagging
- Visualizing key marketing KPIs in Power BI
- Performing ETL operations across SQL, Python, and BI tools
Files and Structure
SQL Files— All queries for data cleaning, joins, and CTE operationsPower BI File (.pbix)— Complete dashboard with KPIs and chartsPython Scripts (.py)— Sentiment analysis using VADER NLPREADME.md— Documentation and insights for each step of the process
Final Remarks
This project showcases the power of combining multiple tools—SQL + Python + Power BI—to create a full-cycle marketing analysis system. It demonstrates both technical and analytical skills crucial to marketing data science roles.
If you’re a recruiter or professional looking to evaluate real-world analytical problem-solving, feel free to browse the source files and results on GitHub. Also if you wanna play around with the project and need help with project setupup reach out to me by mail or linkedin.