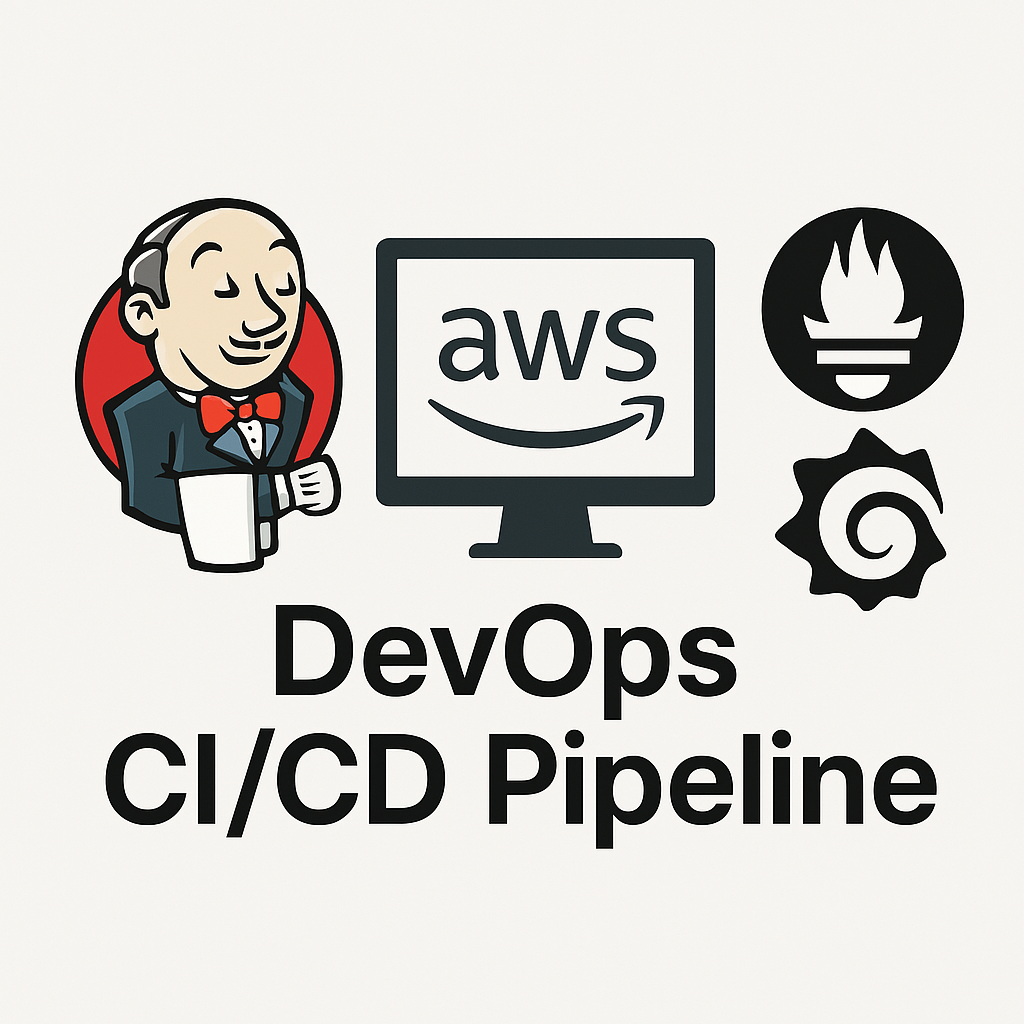
In this blog post, I’ll walk you through how our team built a fully automated CI/CD pipeline using Jenkins, deployed it on AWS EC2, and integrated Prometheus and Grafana for real-time performance monitoring. This project mimics a real-world DevOps setup from code commit to production deployment.
🧠 What It Does
This pipeline automates every step of the software delivery process:
- GitHub commits trigger Jenkins builds using webhooks
- Jenkins installs dependencies, runs automated tests, and deploys to EC2
- Prometheus collects metrics from Jenkins and EC2
- Grafana visualizes those metrics in real time
- The whole system is scalable and continuously monitored
🛠️ Tech Stack
| Tool / Service | Purpose |
|---|---|
Jenkins | Automates build, test, and deployment |
AWS EC2 | Hosts the production server |
GitHub | Version control + webhook integration |
Prometheus | Metrics collection from Jenkins + EC2 |
Grafana | Real-time monitoring dashboards |
Ubuntu 20.04 | Operating system for EC2 instance |
🔍 Why I Built It
Our goal was to eliminate manual deployment pain and create a reliable, test-driven delivery pipeline. As DevOps adoption grows in the industry, this project gave us hands-on experience with automation tools that modern teams use every day.
💡 How It Works
- Code is committed to a private GitHub repository
- GitHub webhook triggers a Jenkins job
- Jenkins pulls the code, installs dependencies, and runs
python -m unittest discover - Jenkins deploys the app to an AWS EC2 instance
- Prometheus scrapes system and Jenkins metrics
- Grafana displays CPU usage, memory, test pass/fail counts, and more
📄 Project Report
👉 Download the Final DevOps Report (PDF)
Includes:
- ✅ Step-by-step pipeline setup
- 🧪 Jenkins config, GitHub webhooks, and test automation
- 📊 Monitoring integration via Prometheus + Grafana
- ⚙️ Real screenshots of dashboards and builds
- 💡 Lessons learned and future improvements
📚 What I Learned
- 🔁 Automating workflows using Jenkins and GitHub webhooks
- 💡 How to expose and scrape metrics using Prometheus
- 📉 Designing Grafana dashboards for real-time observability
- ⚙️ Importance of secure SSH access and EC2 configuration
- 🧪 Continuous testing saves time and prevents bugs
🧠 Final Thoughts
This was one of my most hands-on experiences with full-stack DevOps tooling. By automating builds and monitoring deployments, we saw how real-world teams can reduce bugs, increase reliability, and ship faster with confidence.
Want to learn real DevOps engineering? Replicating this project with Jenkins, EC2, and Grafana is a perfect starting point.
Automate everything. Monitor always. Deploy confidently.